Overview
This is the 52nd monthly report for Print My Blog (PMB) WordPress plugin, documenting my journey to be fairly compensated for my time and reach 10,000 active installs.
💰 $ x/40,674.28(fairly compensated for time)
🖥5,????/10,000 active installs (on-par with other print button plugins)
What Happened This Month
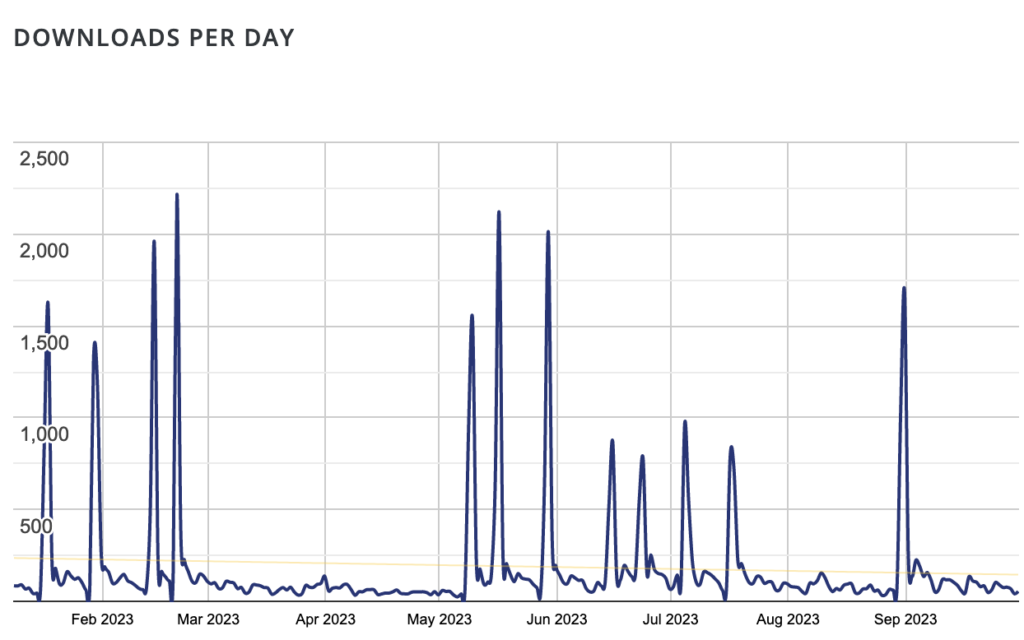
Downloads
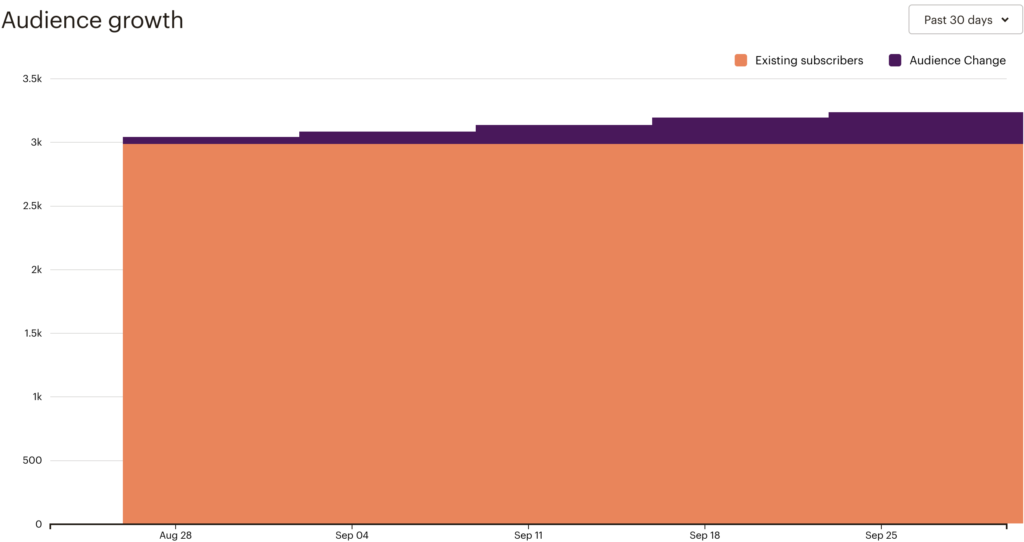
Mailing List Stats
Stats from my MailChimp mailing list.
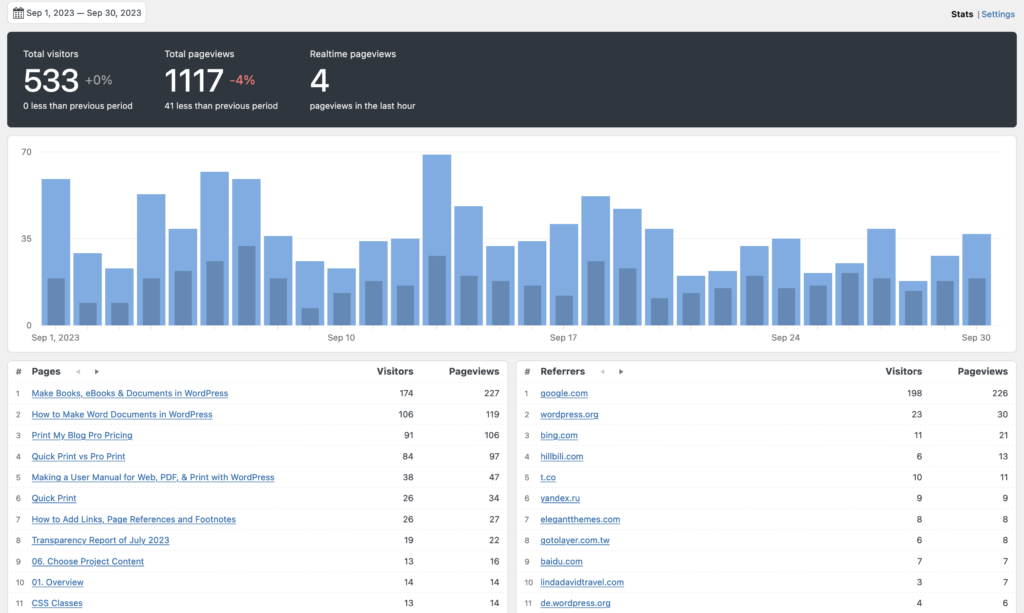
Website Visits
Stats from my site’s Koko analytics (don’t need no Google Analytics, thank you!)
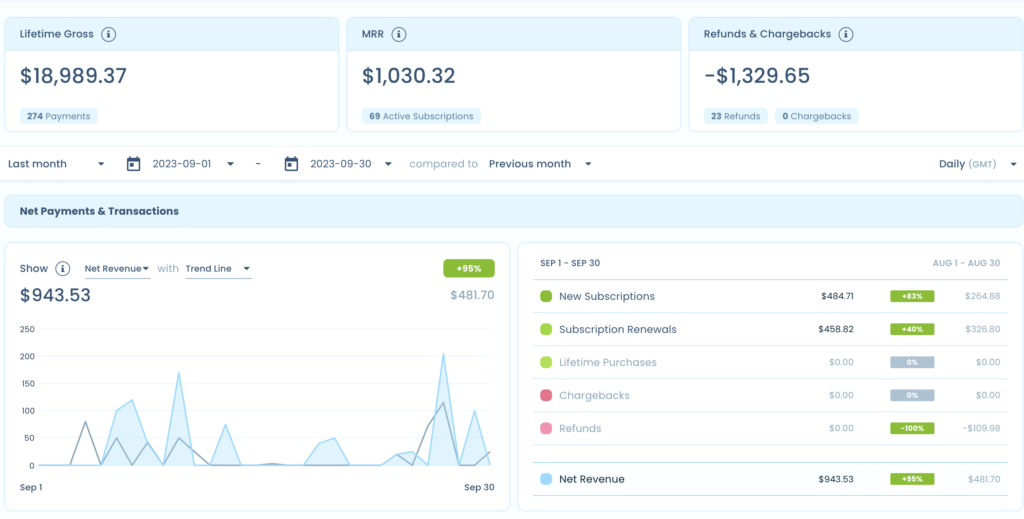
Freemius Stats
Sales
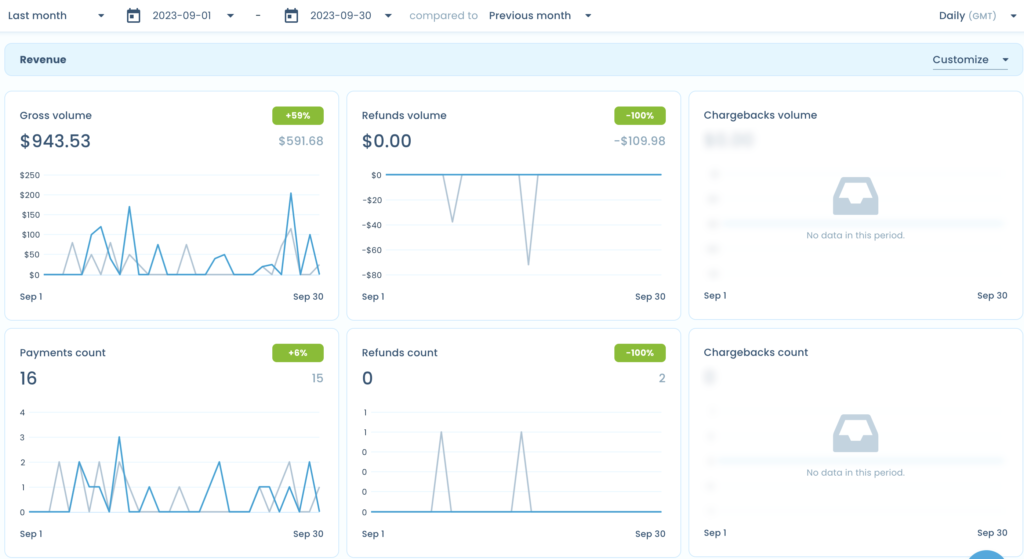
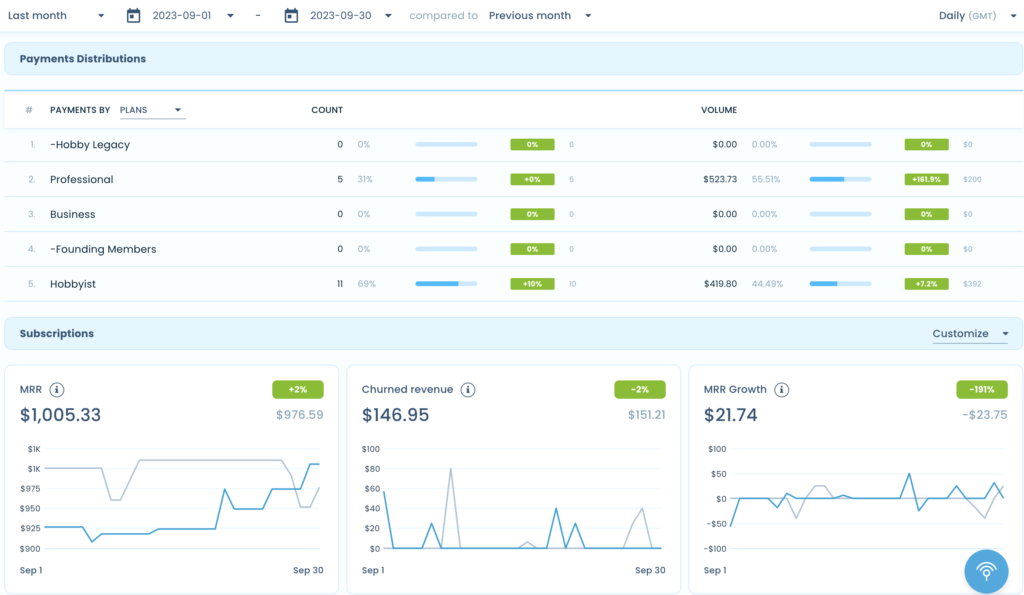
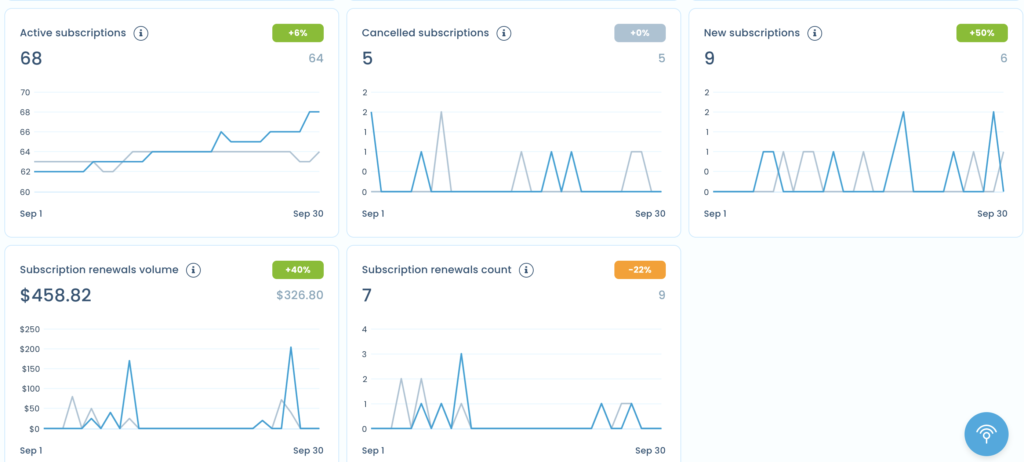


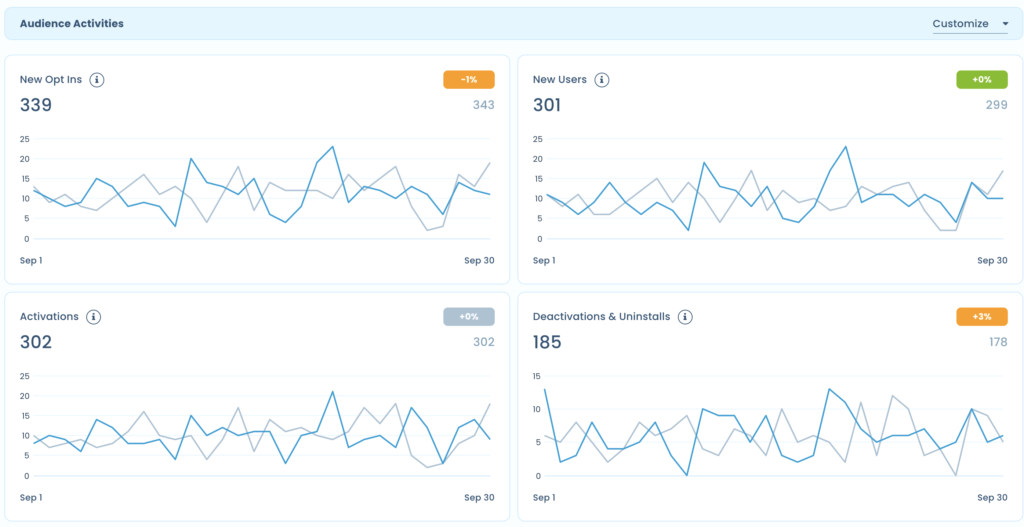
Audience
Finances and More Plugin Stats
The Details
Measurements Article Added
I added a new article to the User Manual titled “Units of Length and Getting Sizes Right” in September 2023. It addresses something I honestly hadn’t ever concretely figured out:
- converting between pixels, points, inches and centimeters
- default page dimensions (height, width, page margins, and font sizes)
This is especially helpful when trying to get an image of the right size to fit on a page with PMB’s Pro PDF Service.
Again Tracking Active Installs
Since August 2022, when WordPress.org stopped sharing the Active Install Growth, my transparency reports really haven’t shown plugin growth.
I could have switched to only using Freemius’ stats for active installs, but it has a bug that counts deactivations of non-opted-in sites withtout ever counting them as activations. And because there was a year there where I removed Freemius’ opt-in screen, and consequently there were very few opt-ins, but still a normal number of deactivations, Freemius started showing active installs as negative. So it’s not great by itself either.
So, I decided to use the WordPress.org-derived numbers until they were no longer available, and then use the change in Freemius’ opted-in sites to the more recent months.
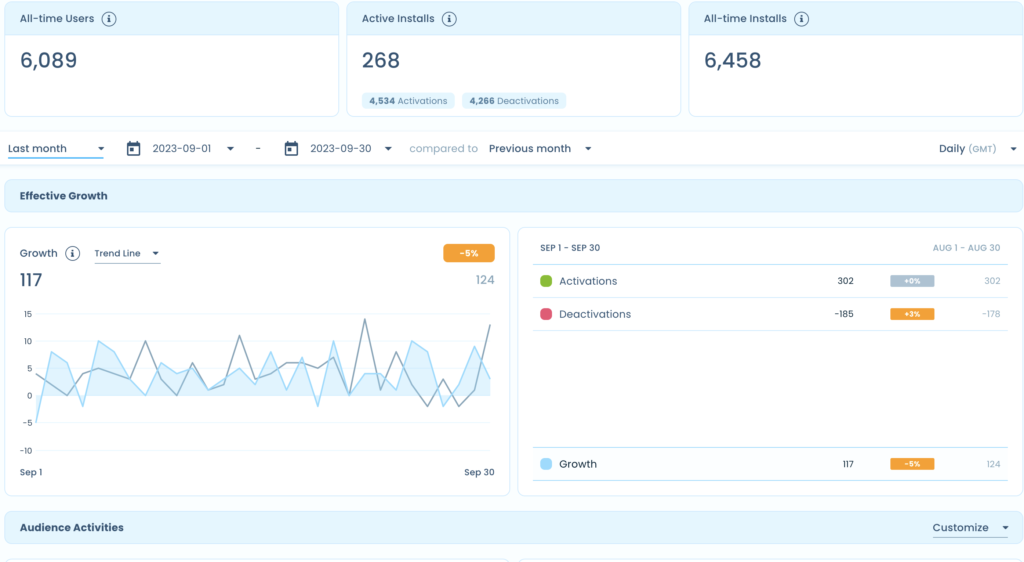
According to this method, PMB should have broken 6,000 active installs this month, but wp.org still shows it as 5,xxx, and Freemius shows it as 268 (which is certainly wrong, as it was negative until recently) or 2,949 (according to the counts of PHP versions). So which is right? They’re each partially right and wrong:
- wp.org (5,xxx) shows the total number of users of the free plugin, but only gives 1 significant digit
- Freemius’ “Active installs” (268) would be good except it counted deactivations of non-opted in sites and so was negative for a couple years, so obviously wrong
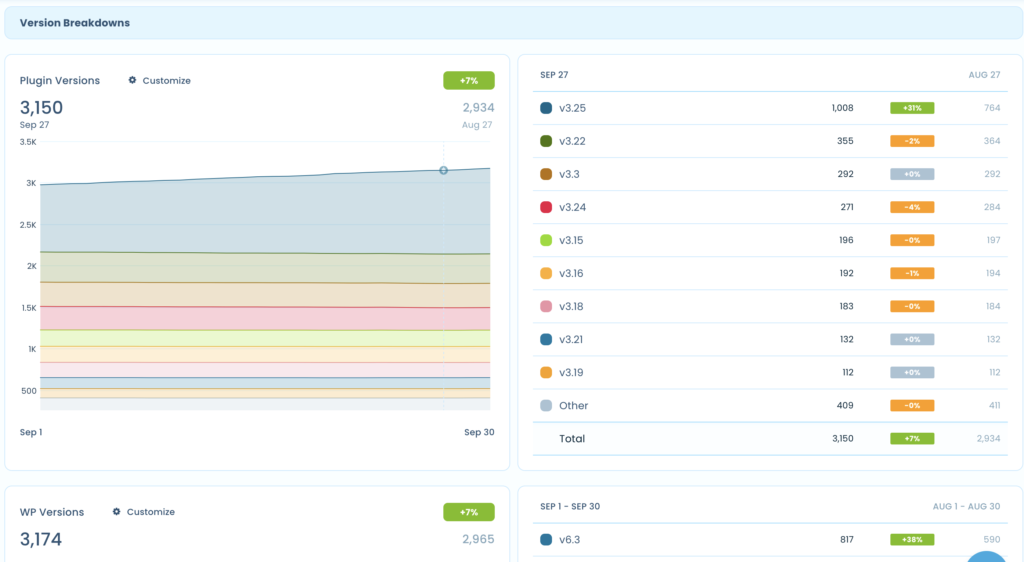
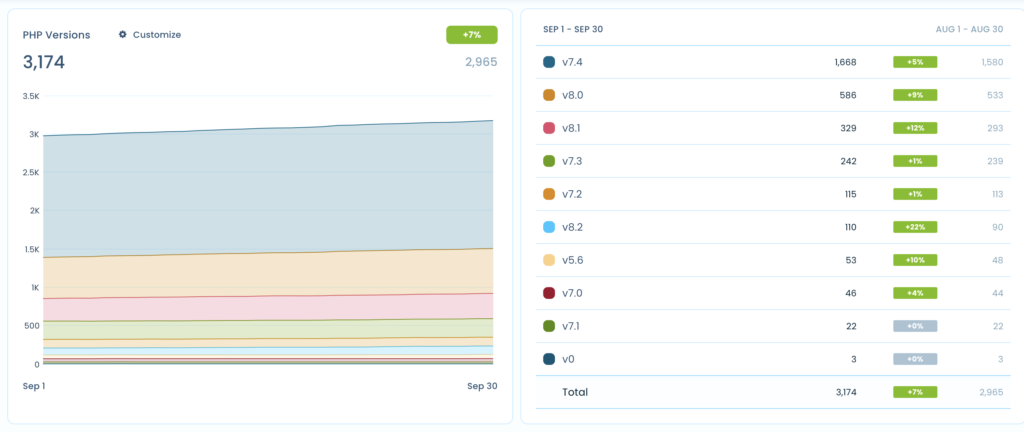
- Freemius’ count of sites using various PHP versions (2,949) doesn’t seem buggy, but it excludes all sites that didn’t opt in
- my mix (wp.org until August 2022, then add Freemius’ monthly growth, 6061) shows all sites until August 2022 then shows new opt-ins
Thinking Out Loud
Transparency Reports are Back on Track!
I admit I don’t have much to report right now, as last month was slow for getting stuff done on the plugin, and the previous month’s transparency report took nearly a month to publish. But at least now this month’s is being reported in a timely fashion.
Phew, Income is Up!
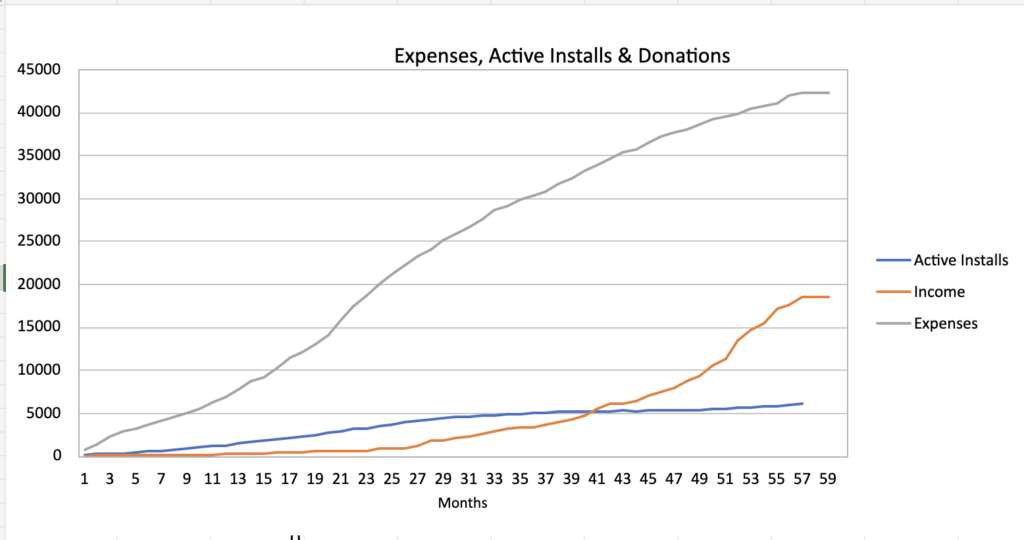
As you can see in the previous graph, while expenses (mostly opportunity cost- or money I could have made if I were consistently earning a wage for my time) have been growing pretty steadily, total income has nearly doubled in the the last year (compared to 4 previous years).
It’s just interesting running a business: I wanted my income to match my input and effort, but they’re really totally unrelated. The times when I put in the most time into PMB (probably 2020, when I was making the pro version) really had no improvement in income. And now, when I haven’t been able to commit as much time to it as previously, income has been up significantly.
If anything there seems to be about a year or two’s gap between effort and payback. So I quite expect that if I don’t put as much into it for a year, I’ll probably see that reflected in income in about a year or two.
What’s Next?
For the 5th month in a row, I’m hoping to start working migrating from MailChimp to Mautic. Then Pro Print buttons, but that will be a big task and I haven’t worked out how exactly I want it to work.
